



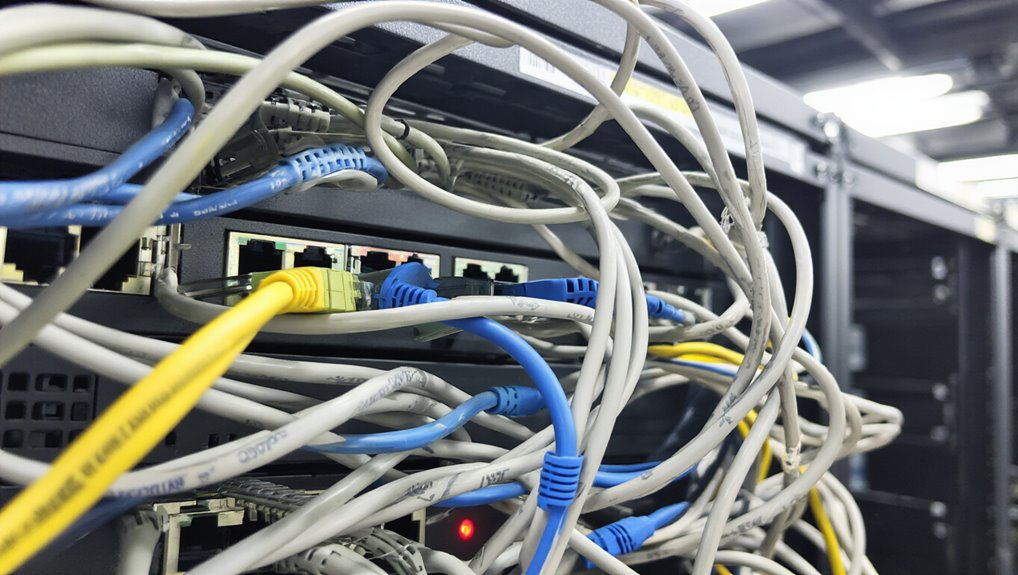
Signs Your API Integration Tool Is the Bottleneck
When an API integration tool becomes a bottleneck, the signs show up in predictable patterns across teams, workflows, and costs. Recognizing them early prevents larger operational damage.
Common indicators include:
Several common indicators reveal when an API integration tool has become a bottleneck rather than an asset.
- Slow delivery on small changes – Minor updates require developer involvement instead of simple configuration edits. This often indicates missing automation capabilities in the integration platform.
- Manual work replacing automation – Teams rely on spreadsheets or copy-paste steps because automated workflows fail or underperform.
- Recurring errors and failures – Broken syncs, duplicate records, and repeated task failures signal instability.
- Weak data flow visibility – Troubleshooting requires digging through logs across multiple systems.
- Rising scaling costs – Each new integration adds separate scripts, credentials, and complexity. Large enterprises frequently manage 250 or more internal APIs, making uncontrolled growth a direct driver of ballooning maintenance and operational costs.
- No baseline for delivery performance – Without tracking deployment frequency and failure rate, teams have no way to identify whether the integration tool itself is degrading engineering throughput over time.
API Integration Bottlenecks That Kill Sync Speed
Slow syncs rarely stem from a single cause—they build from layered inefficiencies that compound across traffic patterns, request volume, data models, and orchestration design.
Common bottlenecks include:
- Traffic shaping failures — rate limits, retry storms, and uncontrolled parallelism stall throughput
- Excess request volume — N+1 calls, payload bloat, and sequential pagination inflate API consumption
- Schema friction — contract mismatches and schema drift break mappings mid-sync
- Orchestration gaps — overlapping jobs, connection churn, and poor queue prioritization delay completion
Each layer compounds the next.
Fixing one without addressing the others produces limited gains. Jira Cloud, for example, enforces a points-based quota system that returns HTTP 429 errors when request volume exceeds its threshold, making unmanaged request loops one of the most common causes of failed syncs. Responses carrying unnecessary fields increase processing time and contribute to higher latency, making payload size a frequently overlooked factor in sync performance degradation. Modern iPaaS platforms also require robust encryption and security controls to keep data secure while improving throughput.
Reliability Red Flags in Your API Integration Logs
Integration logs tell the story of what an API tool is actually doing—and whether it’s doing it reliably. Several red flags signal trouble before failures escalate:
- Error-rate spikes: Rising 500-series responses alongside declining 200s indicate systemic failure, not isolated incidents.
- Latency anomalies: Response times creeping past two seconds, especially paired with errors, suggest downstream dependency problems.
- Availability gaps: Recurring downtime on the same endpoint points to single-point failures.
- Log-pattern inconsistencies: Consistent 200 OK responses returning incomplete data still represent broken integrations.
Catching these patterns early prevents minor issues from becoming delivery-stopping outages. A poor API choice can introduce security vulnerabilities and financial losses that compound the damage already visible in the logs. In healthcare API environments specifically, these log anomalies can expose gaps in HIPAA safeguards, encryption, and audit logging that place protected health information at direct risk. Monitoring for real-time insights helps teams respond quickly and maintain operational visibility.
How Credential and Auth Failures Drag Down API Performance
Authentication failures introduce two distinct problems: hard stops that block requests entirely and hidden slowdowns that degrade performance without triggering obvious errors.
A 401 or 403 response halts execution before business logic runs.
Expired tokens and revoked credentials block legitimate access across protected endpoints.
Performance degradation is subtler.
A token endpoint normally responding in 100 ms but suddenly taking 2 seconds signals regression, even when returning 200 OK.
Response-code monitoring alone misses this.
Common drag factors include:
- Expired or rotated secrets breaking downstream integrations silently
- Slow identity provider responses adding latency to every login attempt
- Token generation failures when signing keys become unavailable
Authentication and authorization failures frequently spike during deployments and security updates, making continuous monitoring essential to catch regressions immediately after configuration changes.
Broken API authentication ranks high in the OWASP Top 10 API Security Risks list, making these credential and performance failures a recognized priority across security and engineering teams.
Designing for elastic scalability and using effective caching can help reduce the impact of authentication-related latency on overall system performance.
Performance Metrics That Expose API Integration Slowdowns
Knowing which metrics to track makes the difference between catching an API integration slowdown early and discovering it after users have already noticed. Several key indicators reveal performance problems before they escalate:
The right metrics don’t just measure performance — they determine whether you catch problems or get caught by them.
- Latency — p95 and p99 values expose slow outliers that averages hide
- Throughput/RPM — falling request rates under stable demand signal internal bottlenecks
- Failed request rate — rising errors often precede full outages
- Availability — uptime alone misleads; pair it with latency data
- CPU and memory usage — sudden spikes reveal capacity pressure
Reviewing these metrics together provides a clearer picture than monitoring any single value alone. In microservices architectures, a slowdown in even one endpoint can compound across the system, causing cascading timeouts that affect multiple dependent services. Uptime is often tied to a service level agreement, making it a contractual benchmark rather than just an internal health signal. Implementing an API gateway also helps centralize monitoring and enforce access controls so issues are detected and mitigated faster.